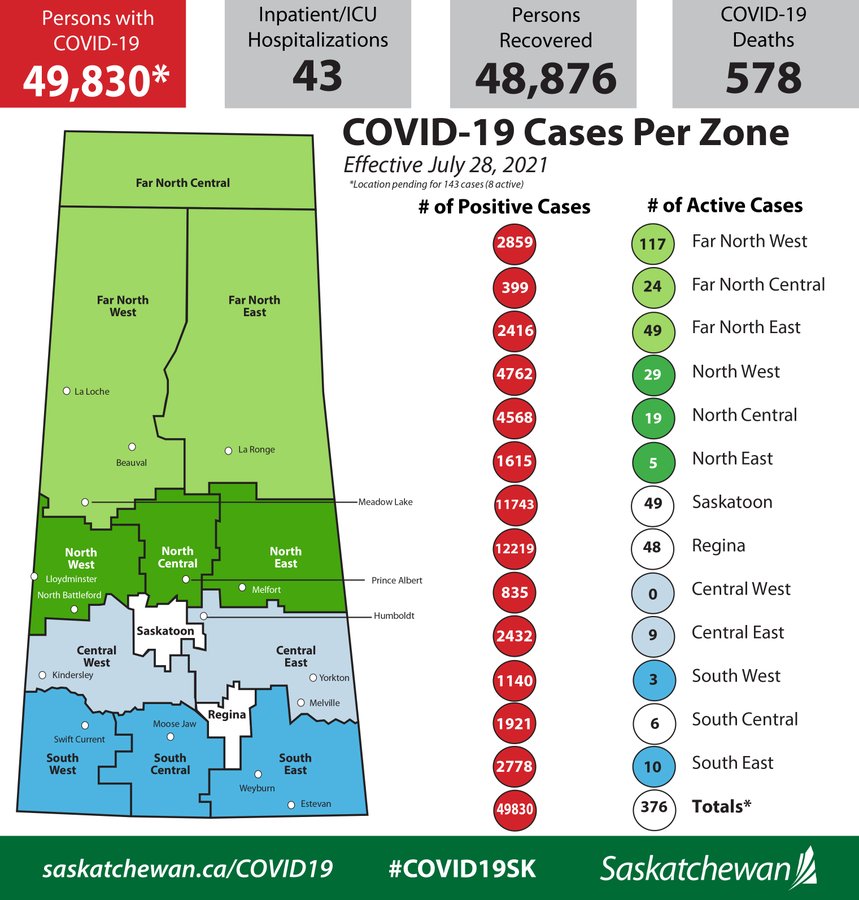
The province is reporting 50 newCOVID-19 cases and 51 recoveries on Tuesday.
Of the 50 new cases, seven are in Regina. The other new cases are located in the Far North West, 10; Far North Central, 8; North West, 1; North Central, 2; North East, 1; Saskatoon, 13; Central East, 3; South West, 1; South Central, 1; and South East, 1. Two cases are pending residence information.
There were no new deaths related to the virus meaning the total number of people in Saskatchewan who have died as a result of COVID-19 stands at 578.
Only 43 people are in hospital. That is the lowest number the province has recorded since November 9, 2020. Of those 43, nine are receiving intensive care.
New lineage results were reported for 88 variants of concern
Cases infected with a variant of concern (VoC), as of July 28, 2021 |
||||||
| Zone | VoCs Detected by Screening |
VoCs Sequenced (WGS) |
Alpha (B.1.1.7) | Beta (B.1.351) | Gamma (P.1) | Delta (B.1.617.2) |
| Far North West | 337 | 270 | 209 | 22 | 39 | |
| Far North Central | 4 | 8 | 4 | 4 | ||
| Far North East | 87 | 157 | 48 | 9 | 100 | |
| North West | 869 | 576 | 321 | 243 | 12 | |
| North Central | 639 | 390 | 325 | 9 | 19 | 37 |
| North East | 84 | 64 | 61 | 1 | 2 | |
| Saskatoon | 2,141 | 1,342 | 1,119 | 1 | 92 | 130 |
| Central West | 150 | 123 | 107 | 2 | 14 | |
| Central East | 654 | 418 | 405 | 4 | 9 | |
| Regina | 4,831 | 3,024 | 2,834 | 1 | 189 | |
| South West | 416 | 276 | 251 | 25 | ||
| South Central | 892 | 639 | 635 | 2 | 2 | |
| South East | 1,156 | 710 | 689 | 1 | 20 | |
| Pending | 83 | 53 | 33 | 5 | 15 | |
| Totals | 12,343 | 8,050 | 7,041 | 10 | 426 | 573 |
On the vaccine front, 4,562 were delivered across the province. Of those, 982 were first doses with the other 3,580 going to people who are now fully vaccinated.
| Status of Population Vaccinations, as of July 27, 2021 | |||
| Group | Estimated Population |
Received First Dose |
Fully Vaccinated |
| Age 80+ | 51,352 | 47,821 (93%) | 45,345 (88%) |
| Age 70-79 | 82,304 | 74,431 (90%) | 70,507 (86%) |
| Age 60-69 | 140,471 | 121,950 (87%) | 113,240 (81%) |
| Age 50-59 | 142,537 | 114,343 (80%) | 101,353 (71%) |
| Age 40-49 | 150,870 | 110,452 (73%) | 93,324 (62%) |
| Age 30-39 | 178,012 | 117,097 (66%) | 93,402 (52%) |
| Age 18-29 | 181,622 | 115,123 (63%) | 82,709 (46%) |
| Age 12-17 | 91,446 | 56,666 (62%) | 36,945 (40%) |


